프로메테우스 그라파나 대시보드 템플릿 적용해보기 (prometheus, grafana)
2021. 1. 21. 14:27ㆍDev
728x90
프로메테우스는 오픈소스 모니터링 서비스입니다.
이 프로메테우스에서 가져온 정보들을 그라파나(grafana)라는 시각화, 대시보드 서비스를 이용해서 보려고 합니다.
grafana.com/grafana/dashboards
Grafana Dashboards - discover and share dashboards for Grafana.
Grafana.com provides a central repository where the community can come together to discover and share dashboards.
grafana.com

저는 첫화면에 있는 Prometheus Node Exporter Full이라는 대시보드를 사용해보겠습니다.
클릭하면

이런 화면으로 넘어가고 Download JSON을 클릭합니다.

그라파나 페이지에서 왼쪽탭에서 + -> import를 누르면

Upload JSON file을 누르고 프로메테우스를 연결하면
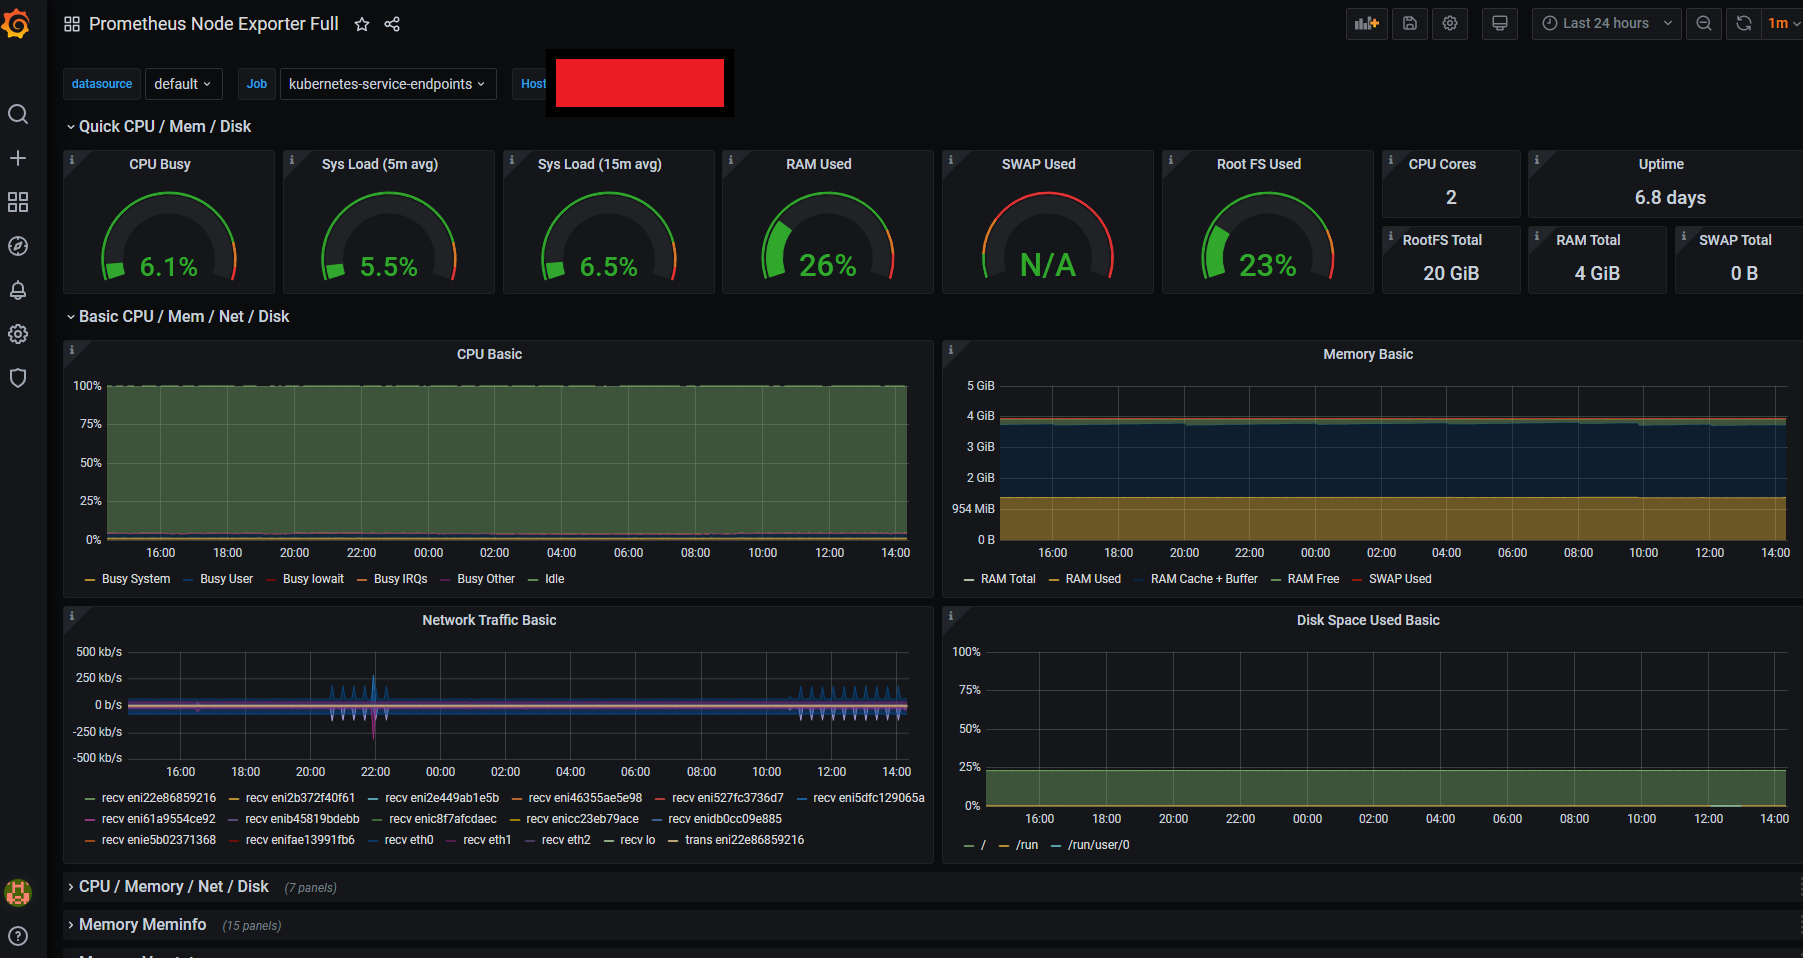
이렇게 대시보드로 확인 할 수 있습니다.
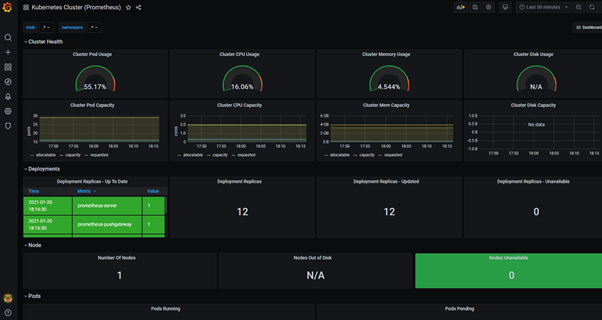
그 외 다른 대시보드
'Dev' 카테고리의 다른 글
| 코멘토 DevOps 부트캠프 후기 (2) | 2021.05.30 |
|---|---|
| pg_config executable not found (0) | 2021.01.30 |
| 이상적인 DevOps 프로세스란? (0) | 2021.01.19 |
| DevOps의 모범사례 6가지 (0) | 2021.01.17 |
| CI/CD란 무엇인가 (0) | 2021.01.08 |